The grid looks tidy: 60 years of picks, 13 columns, one player per cell. The data behind it is messier than that. Round counts changed, two leagues merged, and a college "Quick End" drafted in 1976 isn't anything you'll find on a modern depth chart. This page is about what the chart actually contains, where it came from, and where the picks stop fitting cleanly into a modern label.
Where the data comes from
The base dataset is nflverse,
the open-source successor to nflscrapR. Every drafted player from
the 1967 NFL/AFL Common Draft through the most recent draft is in
nflverse::load_draft_picks(): name, team, round, pick,
college, position. Current-year picks are scraped from Wikipedia
until nflverse catches up; the build script reconciles the two on
the next refresh.
For picks where nflverse's position is too coarse to use directly
(the thousand-plus rows labeled bare "DB" with no
CB-vs-S split, mostly 1967–2014), we fall back to a three-tier
cascade:
| Source | What it gives us | Hit rate |
|---|---|---|
nflverse import_players() |
Granular position / pff_position / ngs_position for players with any modern footprint |
47.6% |
| Wikipedia player infoboxes | Position: Cornerback field on the player's page, found via intitle: search |
+36.9% → 84.5% |
| Pro Football Archives | Per-year draft pages and per-season position tables; covers pre-1980 and never-played-a-snap draftees | +11.0% → 95.5% |
The remaining 4.5% (82 picks, almost all draftees who never played a pro snap) aren't silently bucketed. They show up as a small "🟣 Unassigned DBs at pick #N" note on both the CB-N and S-N cell pages, so a future hand-resolution can claim the draftigami at whichever cell turns out to be right. Full writeup: docs/db-reclassification.md.
The evolution of the draft
1967 is the start line
The chart begins in 1967 because that's the first NFL/AFL Common Draft. Before that, the two leagues drafted separately and routinely outbid each other for the same players. 1967 is where unified history starts.
Round counts shrank, then stabilized
Pre-1994 drafts ran 8–17 rounds, all the way out to pick 442. The modern seven-round era started in 1994 and has held since. The chart caps at round 7 every year (pick 262 in a 32-team era) because including the long tail makes the grid 75% empty space without telling you anything you didn't already know. You still get every meaningful pick: Elway (#1, 1983), Walter Payton (#4, 1975), Lawrence Taylor (#2, 1981), Jerry Rice (#16, 1985), Bruce Smith (#1, 1985), Barry Sanders (#3, 1989), Joe Montana (#82, 1979). The 1994–2026 era button narrows the view to the actual 7-round window.
Compensatory picks
Comp picks (awarded to teams that lost free agents) push the end of round 7 a few slots further each year. The chart treats them as ordinary round-7 picks because that's how the league assigns them.
Positions weren't always standardized
This is where it gets weird. The chart's columns
(QB / RB / WR / TE / OT / OG / C / DE / DT / LB / CB / S / ST)
are all modern labels. Some of them didn't exist in 1970. The
ones that did didn't always mean what they mean now. And college
teams in particular kept using older labels long after the NFL
had moved on.
Here's the defensive depth chart from a real college program, the Bowling Green State University Falcons, going into the 1974 season:
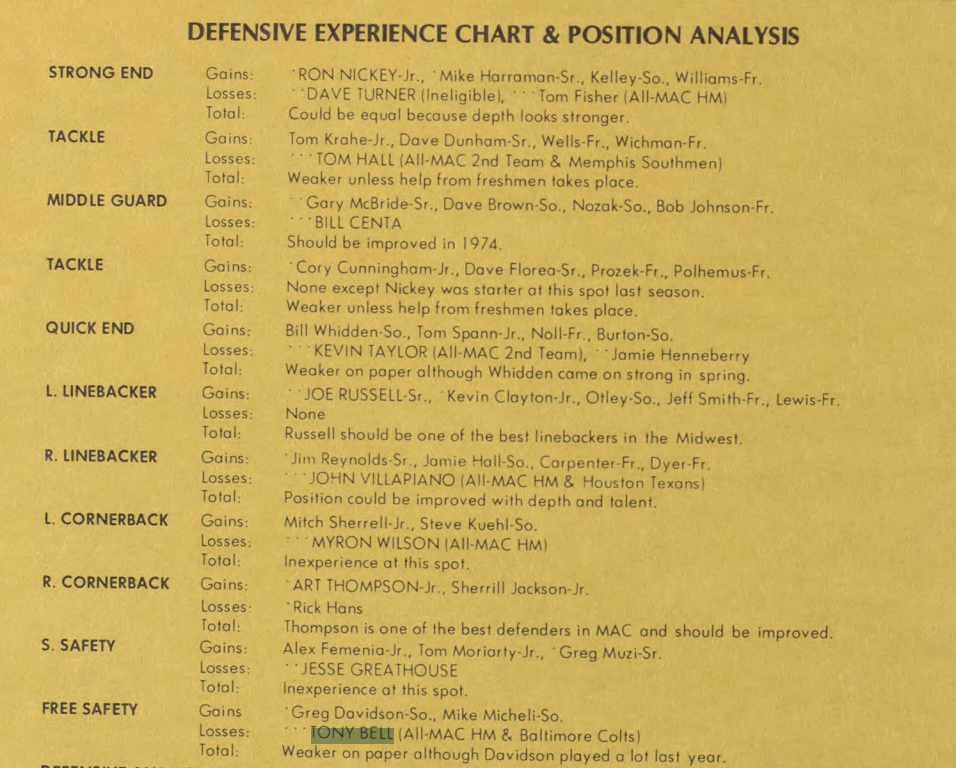
Bowling Green in 1974 was running a 5-2: Strong End, Tackle, Middle Guard, Tackle, Quick End. Strong End played the tight-end side, often as a stand-up edge. Middle Guard was the nose. Quick End was the weak-side rusher you'd probably call a 4-3 DE today, or an outside linebacker depending on the scheme. S. Safety and Free Safety were what now go by SS and FS. Cornerback already existed in 1974, though plenty of programs were still calling that spot "defensive halfback" a few years later.
So when the chart has to put a column on a 1976 draft pick whose only bio line is "4-year letterman at Quick End" and who never played a pro snap, somebody has to make a call. PFA's per-season pro table is empty: no pro seasons happened. Wikipedia, if there's an article at all, usually says "drafted by the Bears as a defensive end" and stops there. The honest answer is "DE who probably would have rotated like a modern OLB if he'd ever gotten on the field." What we actually do is pick the most defensible single column, keep the original raw label so the cell page can still print "drafted as DB" or "listed as Quick End" verbatim, and log the cases where even a single column is dishonest.
It comes up everywhere the game has changed. nflverse carries
WR, SE (split end), and FL
(flanker) as distinct labels through the 70s and 80s; modern
football calls all of those WR, so they collapse to one column.
RBs absorb HB and FB the same way. The
chart doesn't keep a separate fullback column because by the late
90s there'd be almost nothing to put in it. Linebacker stays one
column either way. Outside vs. inside, stand-up edge vs. OLB,
3-4 vs. 4-3: teams have used those labels too inconsistently
across decades to split reliably. Bare OL rolls into
C, which is the modal interpretation for a pre-1980 snapper
prospect that nobody bothered to label more granularly. And bare
DB, all 1,817 picks of it, gets the cascade in
the next section.
The columns are fixed. The football inside them isn't. Read pre-1980 cells as "closest modern equivalent," not as exact matches.
The "DB" problem and how we resolved it
For most of the chart's history, nflverse labels every defensive
back as bare DB. 1,817 picks across 1967–2025, with
a clean granular window 2015–2020 and then a regression back to
DB for 2021–2025. Map all of those to one bucket and
you lose the cornerback-vs-safety story for almost half of NFL
history.
The visible symptom was on the cb-3 cell page (a
cornerback drafted #3 overall). The year-by-year sparkline
showed normal rates 1968–~1979, then flatlined at 0% from 1979
through 2014. That's 35 straight years of "no CB ever drafted at
#3," followed by a jump to ~5% in 2015 when nflverse adopted
granular labels. That wasn't history. That was a labeling
artifact. Every actual cornerback in those 35 years had been
silently dumped into the safety bucket.
The fix is the three-tier cascade in the sources table: nflverse, then Wikipedia infobox, then Pro Football Archives. Raw labels are preserved so the cell-page narrative can still say "drafted as DB," and the 82 unresolved picks (almost all draftees who never played a pro snap) surface as a cell-page note rather than getting silently bucketed. The full writeup, including the four things that didn't work, is in docs/db-reclassification.md.
Reading the chart: site FAQ
What is draftigami?
Draftigami is the art of making a positional draft pick that has never been made before in NFL history. Some combinations (a QB at #1) happen constantly. Some (a long snapper in round 1) have never happened. This chart shows all of them, from the 1967 NFL/AFL Common Draft through the most recent draft.
Can I combine the line groups into single columns?
Yes. Flip the Combine: O-line / D-line / Secondary checkboxes up top. Default is granular (OT / OG / C, DE / DT, CB / S as separate columns) because the position-by-pick combinations are the whole point. Combining collapses each group into a single column (OL, DL, DB) for a cleaner read. Linebacker stays combined either way (OLB/ILB/MLB labeling shifted too much across decades to be reliable).
Why does the chart start in 1967 and stop at round 7?
1967 is the first NFL/AFL Common Draft, the start of the modern unified draft. Pre-1994 drafts went 8–17 rounds, all the way out to pick 442. Including those late rounds would make the chart 75% empty space and obscure the actual story, so the chart caps at round 7 of each year's draft. You still get Elway (#1, 1983), Payton (#4, 1975), Lawrence Taylor (#2, 1981), Jerry Rice (#16, 1985), Bruce Smith (#1, 1985), Barry Sanders (#3, 1989), and Joe Montana (#82, 1979, the third-round legend). The 1994–2026 button narrows to the actual 7-round era only.
How does the model that ranks rare picks work?
Every cell page shows a sparkline of P(position | pick, year), forward-chained across draft history. The model behind it is a 2D tensor-product P-spline GAM — fit by L-BFGS, smoothness baked into the basis. See the writeup + interactive surface →
What happened to the homepage FAQ?
It moved here. The chart was getting too tall to scroll past on a phone, and the FAQ was the easiest thing to relocate. The data-sources and position-evolution sections above are new.
Origin & credits
The idea comes from Jon Bois's Chart Party series at SB Nation (now Secret Base). His 2017 video "Every NFL Score Ever" introduced the concept of scorigami: final scores no NFL game has ever produced. It's one of the great pieces of sports writing on the internet, and it's the direct inspiration for this. If you've never seen it, watch it now:
The live tracker site at
nflscorigami.com grew out
of that video and the @nflscorigami bot. Bois's
adjacent work on Dorktown (the per-team historical deep
dives, like the legendary Mariners series) is in the same spirit
and worth your time too.
This site is by Andy Martin, a tribute to the original. Data from nflverse, with current-year picks scraped from Wikipedia until nflverse catches up, plus the Wikipedia/PFA cascade described above for pre-granular DB resolution.